

In order to assess the actual consumption of energy resources, in accordance with the task of Activity 3.1 of the project, a pilot system of energy monitoring for the university building was designed and partially implemented (https://dash.smart-mac.com/
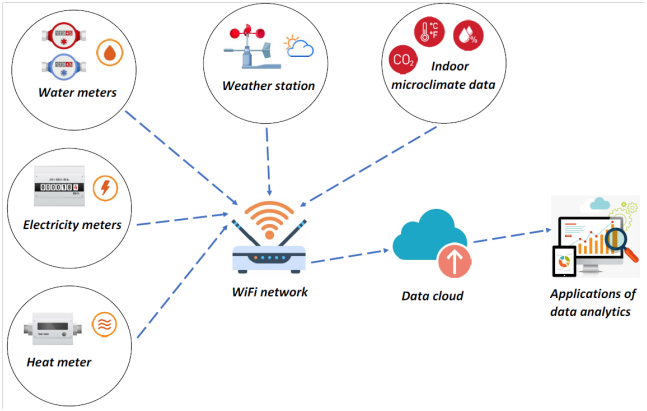
Figure 1 - Block diagram of the energy monitoring system for the university building
The energy monitoring system (Fig. 1) will provide real data on the consumption of electricity and heat, cold and hot water for the university building. In addition, each training room is provided with the monitoring of the main indicators of the microclimate - temperature and humidity, carbon dioxide concentration. A separate component of the monitoring system is a meteorological module that will monitor the temperature and humidity of the outside air, wind direction and speed, atmospheric pressure, intensity of solar radiation (insolation), the value and trend of changes in atmospheric pressure.
The monitoring system is created on the basis of "smart" devices of energy monitors of the Ukrainian company smart-MAC (https://smart-mac.com/) (Fig. 2, 3). All data obtained in the course of the monitoring process are available for viewing in real time on any device (PC, tablet, smartphone) and stored for further analysis in the cloud storage. The web application of the system makes it extremely convenient to present monitoring data with excellent visualization.
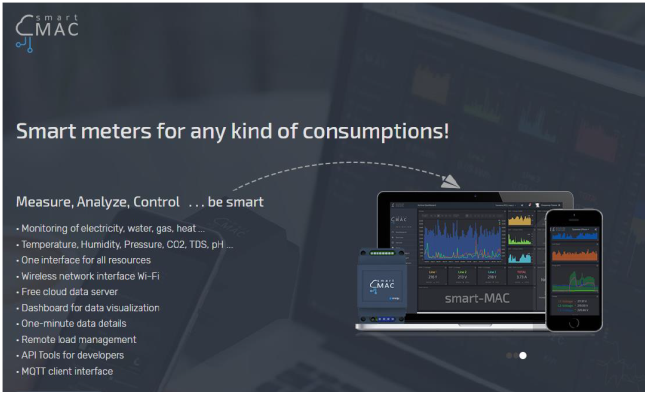
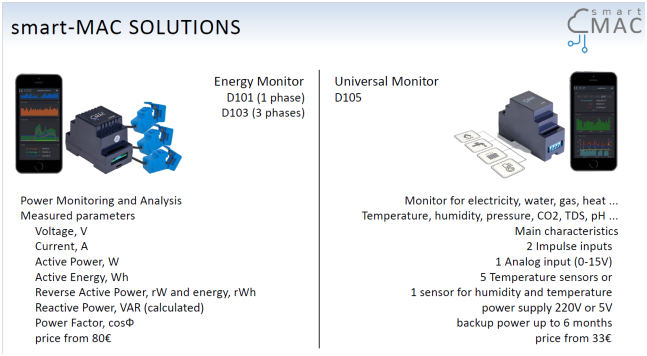
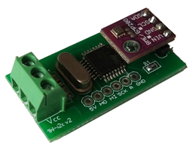
Figure 2 - Presentation of "smart" devices of smart-MAC to solve energy consumption monitoring problems
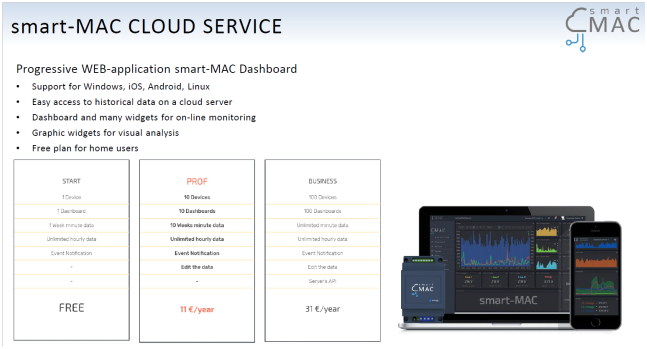
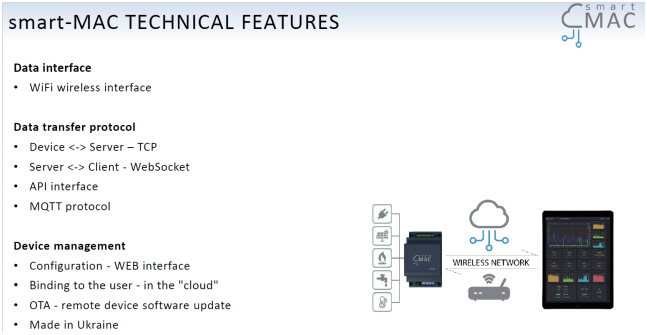
Figure 3 - Capabilities of smart-MAC smart devices for data collection and visualization regarding energy consumption
The obtained data on actual energy consumption, after the installation of the pilot monitoring system, during the calendar year will allow to estimate the specific thermal characteristics of the building, determine the actual energy consumption to ensure regulatory microclimate in the building, assess the rationality and trends of energy consumption. Also, such data will help to assess the real effect after the implementation of energy efficiency measures to reduce energy consumption in university buildings.
The pilot energy monitoring system for the university building is being deployed on the basis of the Department of Energy Management and Technical Diagnostics of IFNTUNG. The Department of Energy Management and Technical Diagnostics occupies a third part of the academic building №9 of the university and is located on two floors of the building. Accordingly, on the basis of the premises of the department it is possible to completely model the energy monitoring system, which can then be extended by analogy to other university buildings.
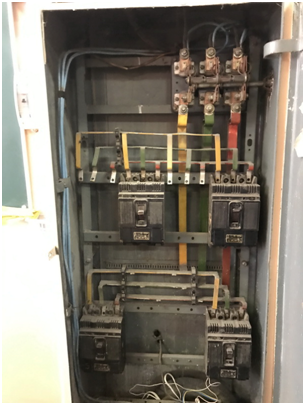
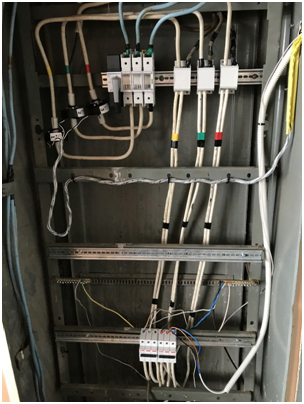
Before the installation of the pilot energy monitoring system for the university building, the engineering networks at the Department of Energy Management and Technical Diagnostics were reconstructed, an example of such reconstruction is displayed in Fig. 4.
a) b)
Figure 4 - Reconstruction of the electrical distribution cabinet through which the power supply of the Department of Energy Management and Technical Diagnostics is carried out (classroom 9119):
a) – before reconstruction, b) – after reconstruction
D103 smart-MAC power monitors with clip-on current transformers were used to monitor electricity consumption. To determine the parameters of the microclimate universal energy monitors D105 smart-MAC were used, which are equipped with sensors of humidity, temperature and СО2 concentration. Structurally, the energy monitors were placed in plastic switchboards and connected to a WiFi network for remote data transmission. The display of energy consumption and microclimate parameters and analysis of the collected data is performed in the web application of the energy monitoring system, which is supported by the manufacturer - smart-MAC company. For each room and node of energy consumption measurement its own page in the web application with digital and graphic representation of character of the current data of energy consumption and change of energy consumption during observation time (Fig. 5-9) is developed.
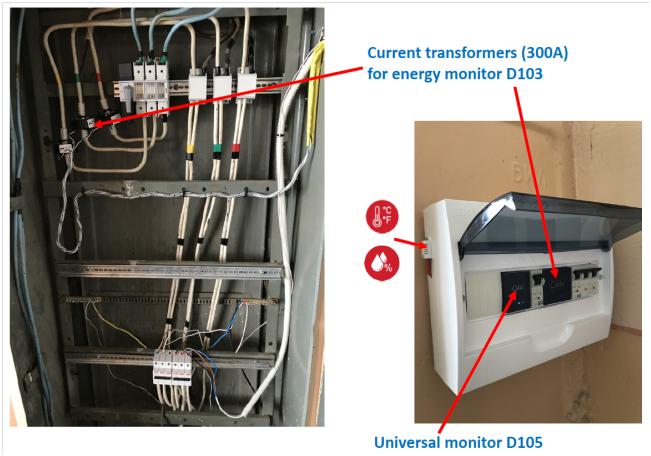
Figure 5 - Installation of current transformers in the electrical distribution cabinet for the segment of the energy monitoring system (electricity consumption, monitoring of temperature and humidity in the room) for the classroom 9119 of the Department of Energy Management and Technical Diagnostics
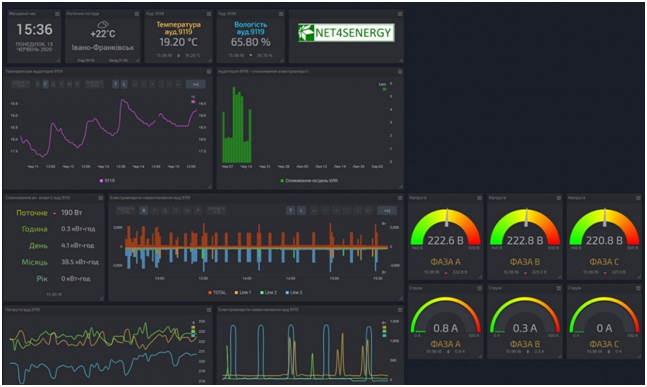
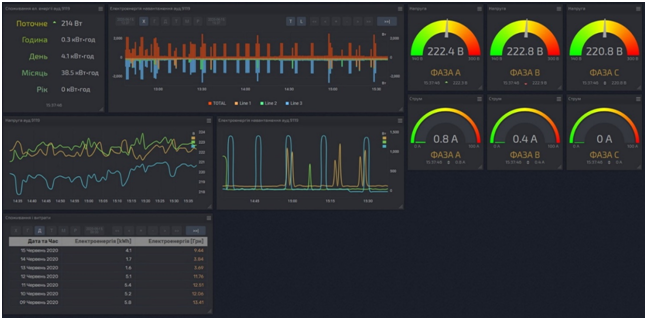
Figure 6 - Display of energy consumption and microclimate parameters for the classroom 9119 of the Department of Energy Management and Technical Diagnostics in the web application of the energy monitoring system
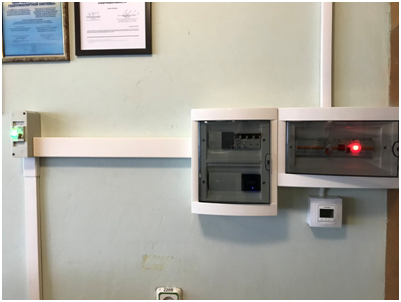
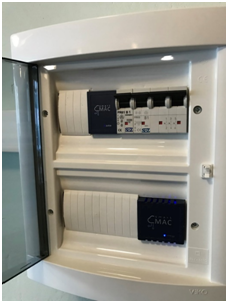
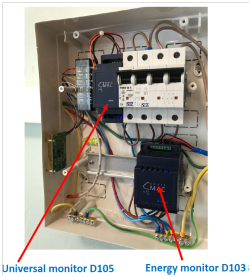
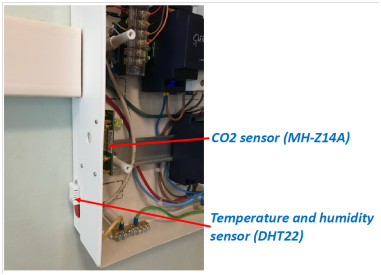
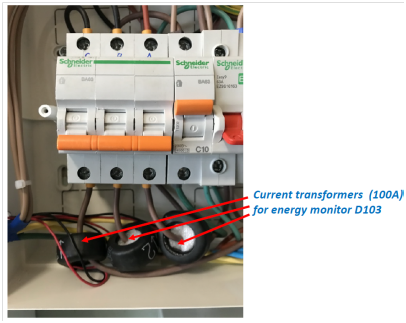
Figure 7 - Installation of the segment of the energy monitoring system (electricity consumption, monitoring of temperature and humidity, carbon dioxide concentration) for the classroom 9203 of the Department of Energy Management and Technical Diagnostics
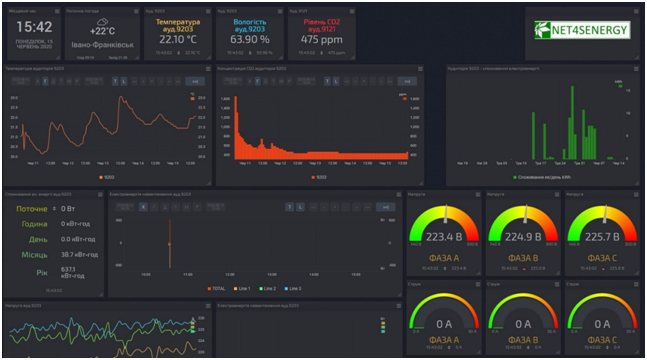
Figure 8 - Display of energy consumption and microclimate parameters for the classroom 9119 of the Department of Energy Management and Technical Diagnostics in the web application of the energy monitoring system
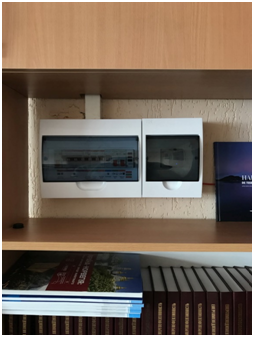
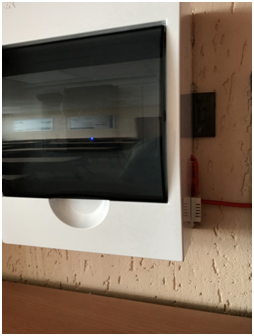
Figure 9 - Installation of a segment of the energy monitoring system (monitoring of temperature and humidity, carbon dioxide concentration in the room) for the classroom 9121 of the Department of Energy Management and Technical Diagnostics
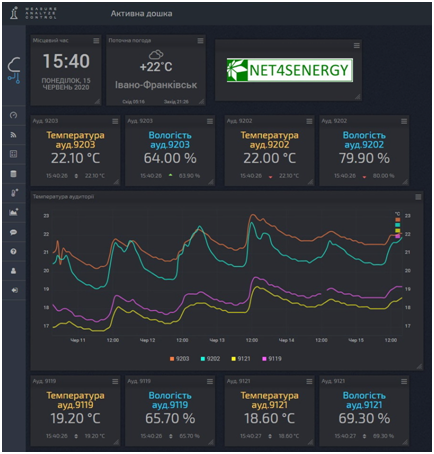
Figure 10 - Display of microclimate parameters (temperature and humidity) for classrooms of the Department of Energy Management and Technical Diagnostics in the web application of the energy monitoring system
Electric meters were installed for the classrooms of the Department of Energy Management and Technical Diagnostics, which are equipped with electric heating (electric convectors, infrared panels) and water heating systems (electric boilers), for technological accounting and visual display of consumed electricity (Fig. 11). Data are transmitted from the electricity meter to the energy monitoring system via a telemetry pulse output connected to the universal energy monitor D105 smart-MAC (Fig. 12).
To estimate the consumption of hot and cold water for the needs of the educational building, the monitoring system uses water meters with a pulse output, which is connected to the universal energy monitor D105 smart-MAC. An example of accounting for hot water consumed from an electric boiler and data transfer to the energy monitoring system is shown in Fig. 13 and 14.
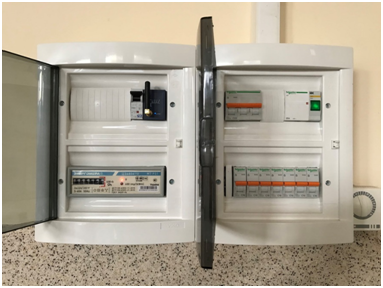
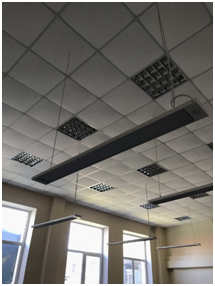
Figure 11 - Panel of energy monitoring and power supply for infrared electric heating system of the classroom 9124 of the Department of Energy Management and Technical Diagnostics
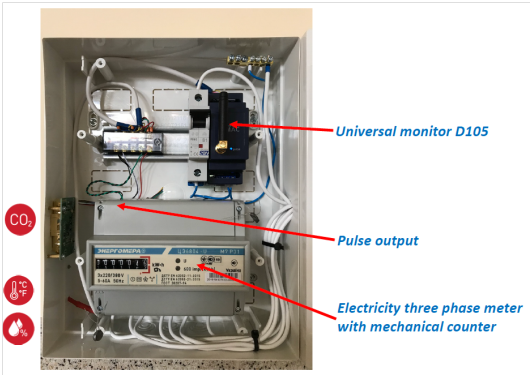
Figure 12 - Installation of a segment of the energy monitoring system (electricity consumption, monitoring of temperature and humidity, carbon dioxide concentration in the room) for the classroom 9124 of the Department of Energy Management and Technical Diagnostics
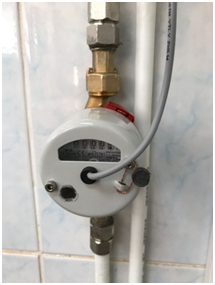
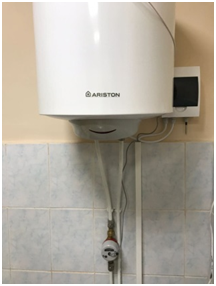
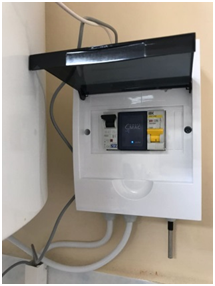
Figure 13 - Technical implementation of monitoring of hot water consumption and air temperature for the classroom 9200 of the Department of Energy Management and Technical Diagnostics
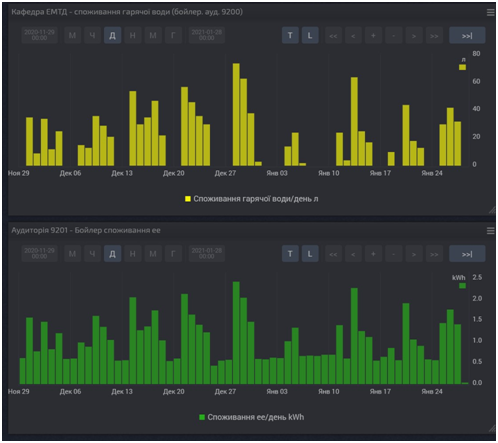
Figure 14 - Display in the form of a histogram of daily consumption of hot water and, accordingly, electricity consumed in the electric boiler for heating and maintaining water temperature in the web application of the energy monitoring system
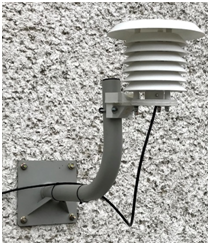
The meteorological module is an important element that allows to obtain data on the parameters of the external environment as factors influencing the consumption of energy resources in the university building. During the implementation of the first phase of the project, equipment for monitoring the change of temperature and humidity of ambient air and atmospheric pressure was mounted and connected to the system. The measurement is performed using a smart-MAC sensor of temperature, humidity and atmospheric pressure, which is mounted in a radiation screen (Stevenson screen) for protection from direct sunlight and placed on the north side of the building in the shade (Fig. 15). The sensor is connected to the universal energy monitor D105 smart-MAC to transfer metadata to the energy monitoring system (Fig. 16).
а) b)
Figure 15 - Equipment for monitoring changes in temperature and humidity of ambient air and atmospheric pressure of the meteorological module of the energy monitoring system: a) sensor of temperature, humidity and atmospheric pressure smart-MAC, b) placing the sensor inside the radiation shield on the north side of the building in the shade
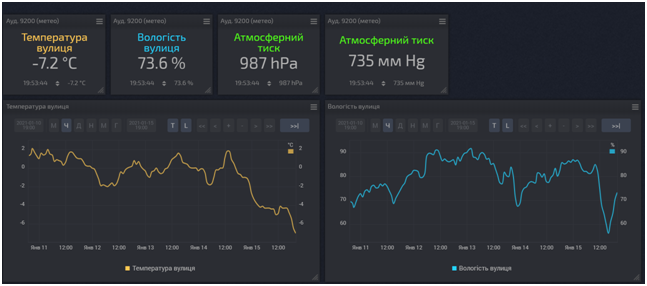
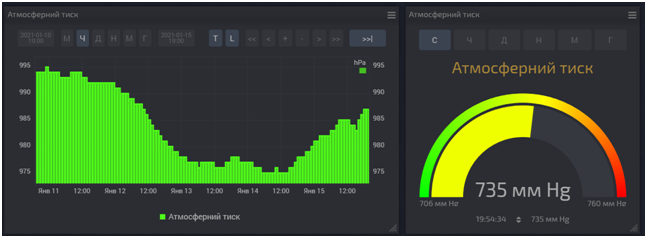
Figure 16 - Display of meteorological data (temperature and humidity, value and trend of atmospheric pressure) in the web application of the energy monitoring system